Overview: Your audience and goals are key. Make things simple. Make common questions fun. Find what is topical to your audience. Help Tell a Bigger Story.
We’ve all scrolled through them in our Pinterest feeds. A catchy title grabs our attention. Brightly colored illustrations trigger our brain to look and browse through facts and figures quickly. Simple charts help us understand something complicated. This leaves us primed with facts and figures and ready to boast of our intellectual prowess at the next cocktail hour.
Infographics are a visualization of information in ways that help us comprehend quickly and in an entertaining way. The research behind their success within a content strategy is compelling.
By adding a color visual, like an infographic, to an article, the willingness of the viewer to read that article jumps by 80%. With an added infographic, viewers are also retaining the information for much longer than they would having just read a page of text. Viewers are 55% more likely to retain information from text paired with a visual than simply text alone. Infographics are worth adopting when you are working on top-of-funnel lead generation or expanding your company’s brand engagement.
So what types of infographics should you create for your company? Infographic topics can vary greatly depending on several factors:
- Audience
- Goals
- Subject Matter
We’ve broken down four types of infographics based on objectives we see most commonly.
Infographics that Make Things Simple
We work with a large variety of businesses that often touch on complex subject matters. Infographics are a great way to make dry, technical, or just plain difficult subject matter, easy to understand for potential clients. The benefit to our clients is that having these resources on their site shows industry know-how and expertise in a down-to-earth yet educated way.
How a Real Estate IRA Can Grow Your Wealth
This graphic explains a complex subject in a simple, visual way, using a real-life example. Infographics are the perfect solution for this client in an industry that is complex, highly regulated, and fairly unknown to the common investor. This infographic targets a new-to-the-industry potential customer that will be cultivated over time.

Infographics that Make Common Questions Fun
When asking a series of questions, receiving bulky paragraph answers can be difficult to sift through. Though there is importance to a certain level of detail, it is not always a necessity for an introduction to a certain topic. Infographics are a great way to answer questions in a new way for a new audience.
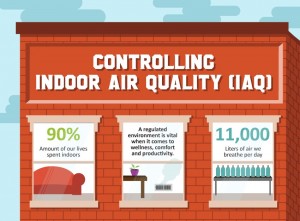
Controlling Indoor Air Quality
This infographic works well because it answers common questions about indoor air quality (why is it important, what are the health effects or poor indoor air quality, what is sick building syndrome, what are the different types of air purifiers, etc.) It also has a fun background that plays well on social media and to the fun-loving personality of the client as a whole.
Infographics that are Topical for Your Target Audience
Visualizing a topic or question that is currently trending in your industry is an excellent way to position yourself at the forefront of the conversation. These infographics require a healthy knowledge of your target audience or customer and what information they consume now as well as the information you expect them to be looking for in the future.
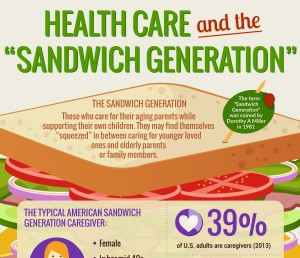
Healthcare and the Sandwich Generation
Do you know what the ‘Sandwich Generation’ is? You probably know someone who falls into this category. This infographic does an excellent job of reaching its audience by educating them and providing them with helpful statistics and resources.
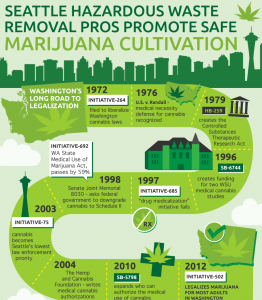
Seattle Hazardous Waste Removal Pros Promote Safe Marijuana Cultivation
This topic took the recent legalization of marijuana in Washington (at the time) and targeted the many new businesses that would be generated as part of that event. This infographic did well on Facebook and helped the client stay current with the emerging cannabis industry.
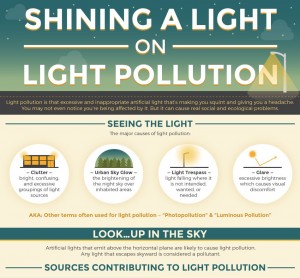
Shining a Light on Light Pollution
Light pollution is impacting our sleep patterns and causing other health challenges. The client wanted to focus on its younger audience who are growing up with sleep issues as the norm and this infographic truly delivers.
Infographics that Help Tell a Bigger Story
Infographics are often developed to help support content on a client’s website that is interesting, but not getting the return the client is hoping to see. Like I mentioned earlier, visually interesting infographics, explainer videos, and other visual elements are great additions to service pages and articles in need of more engagement or improved conversion numbers.
The below infographic helped clients achieve better results from key service pages.
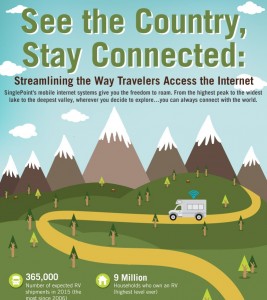
See the Country, Stay Connected
This infographic caught the eye of those who didn’t have the time to read a long article and it became the highest viewed blog post for this site (out of hundreds). This infographic had multiple shares on social media, including Facebook and Google+, helping to increase brand awareness for the client. The infographic also speaks to both RV and boating enthusiasts, two very important audiences for this client.
Infographics can not only increase brand awareness, but also position you as an expert in the industry. Shares, “Likes”, Tweets, and links to your website are just some of the many additional benefits. Visual content is an increasingly important marketing tool. Screens are getting smaller (think mobile devices and tablets), attention spans are getting shorter, and Google search is becoming more and more competitive. Well thought-out, compelling, and useful infographics are one way to stand out from the crowd.
Learn more about infographic development and the importance of visual content.