We have all heard that content is king, however it is getting harder and harder to differentiate this content as everyone is now creating it. Great content is no longer a competitive advantage; it has become a necessity to stay alive. Companies are all blogging, creating videos, and making infographics. On Visual.ly alone there are over 38,000 infographics and data visualizations. This saturated market makes it even more important to find ways to stand out among your competitors in order to gain social shares, followers, and links.
Here are 5 ways to make your infographics stand out from competitors, both visually and conceptually.
1. Make sure your topics are relevant and trending
 If people are not searching for the topic of your infographic, odds are that it will not be shared or linked to.
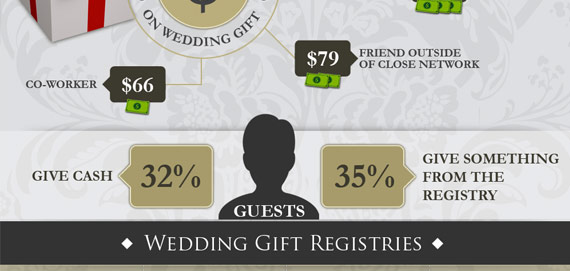
Content that highlights lists of things that are happening NOW get traffic, such as this infographic below on the hot technology gadgets of 2013.
2. Do something different
So many infographics look the same with the same topics and the same layout and color scheme. If you want others to notice your content, make sure it stands out from others in look, feel, and functionality.
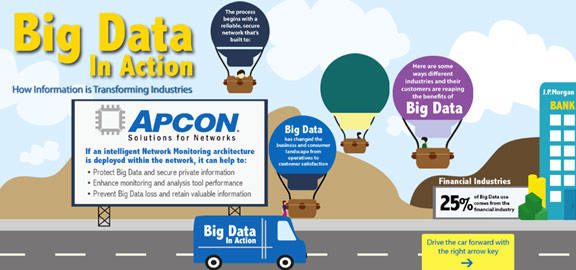
Check out this interactive infographic on big data in action within different industries. Users are able to “drive” the car through the town while information appears.
3. Find a new outlook on a commonly used topic
There are many topics that have thousands of infographics created around them. If you want to have your topic stand out in this competitive topic area, you have to find a new angle.
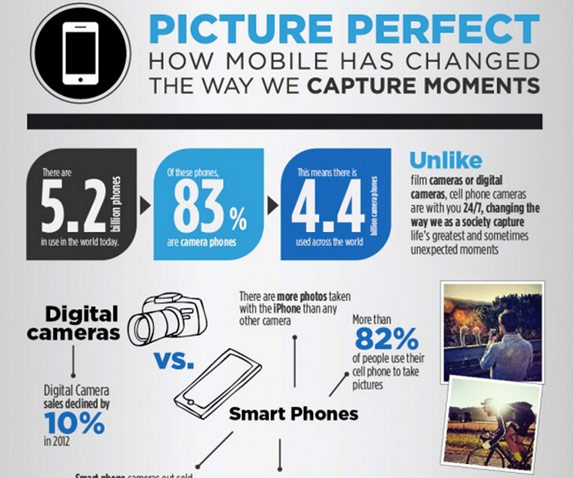
This infographic takes the common theme of mobile and then focuses on something that is still completely relatable to the population, but is very rarely addressed.
Pick local fan topics
 Find things that have a strong following in your local area such as sports teams, professional and college or large, popular events. People can directly relate to these types of topics and are more willing to share them with their friends.
Create visual information that is actually useful
Many infographics focus on topics that are informative or mildly entertaining, though people start ignoring this type of content after awhile because there is so much of it available.
However, if your content actually provides value to the reader in the way of helpful tips or instructions, people are more willing to actually consume the content. These are examples of infographics that give useful information people can use.