Despite being free, Google Analytics is an extremely powerful tool. You can get a lot of actionable data if you know where to look. I’ve been working with Google Analytics for eight years (it used to be called Urchin) and today I want to share with you the 10 most valuable reports it can provide.
Conversions by Traffic Source
Whether a conversion means a sale, a download or a lead it’s extremely important that you understand where these conversions are coming from. Start by changing the date on Google Analytics to the past 12 months.
![]()
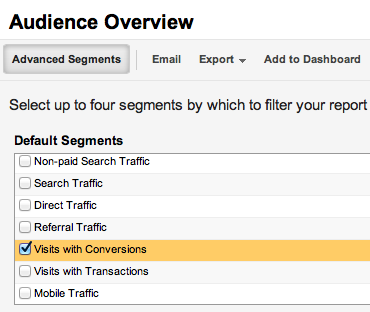
Use Advanced Segments to show only visits with conversions.
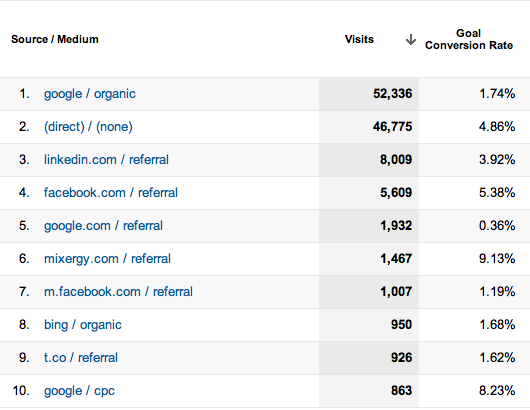
Now go to Traffic Sources > Sources > All Traffic.
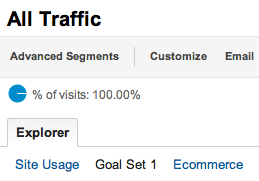
At the very top of the report click on Goal Set 1 (if you’re tracking leads or downloads) or Ecommerce (if you have an ecommerce website).
Now you can see the conversion rate for each of your traffic sources.
If you want to know how many leads you got from each traffic source you can always export the report into an Excel spreadsheet and do a quick formula to multiply the total traffic by the conversion rate.
Conversions by Keyword
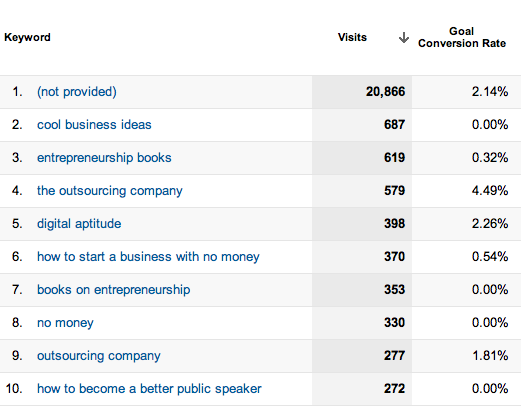
You can do the exact same thing to figure out what keywords are driving conversions. Go to Traffic Sources > Search > Organic for organic traffic or Traffic Sources > Search > Paid for paid search.
Total Traffic by Source Compared to the Previous Year
I believe it’s extremely important for marketers to do this analysis once per year: take a look at all your traffic sources and see which ones generated more traffic than last year and which ones generated less traffic.
To do this set the dates to the last 12 months, check the box that says “Compare to” and select “previous year” from the dropdown box.
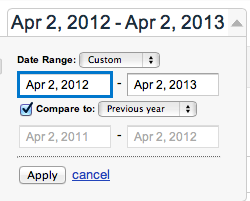
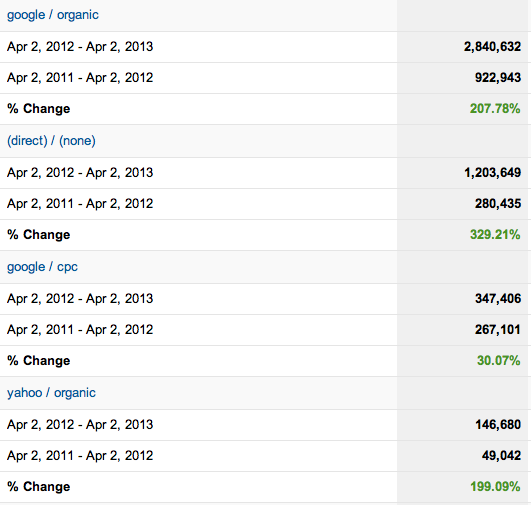
Now go to Traffic Sources > Sources > All Traffic. This will show you where you’ve lost and gained traffic compared to the previous year.
Conversions by Source Compared to the Previous Year
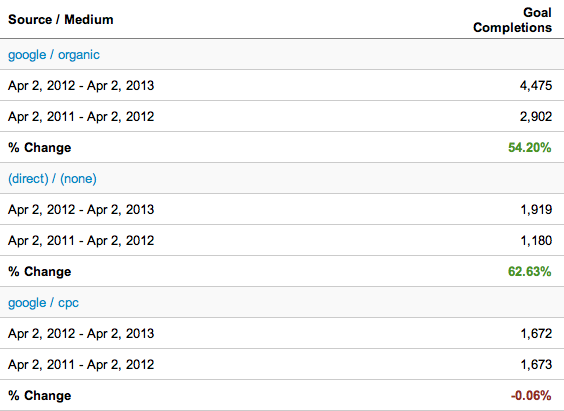
Looking at traffic is great, but you should care more about conversions than traffic. To check for conversions, follow the same steps described in the previous report but go to Conversions > Goals > Overview. Finally, click on “Source / Medium.”
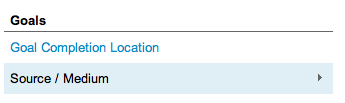
Now you can see the conversions you got in the last year compared to the previous year, all broken down by traffic sources.
Search Terms
Looking at what your visitors search for on your website is one of the best ways to understand what they want. If you haven’t set up Site Search, I highly recommend doing it so you can start tracking what people search for on your site. This tutorial explains how to do it.
Once it’s set up, go to Content > Site Search > Search Terms. The report looks like this:
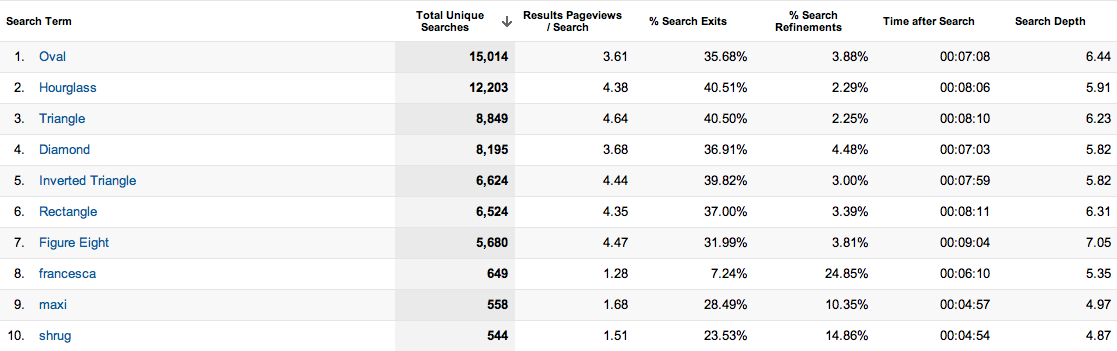
“% Search Exits” is the percentage of people who leave the website after doing a search. This can help you understand what search terms don’t produce relevant results so you can address that problem. “% Search Refinements” is the percentage of people who do an additional search to refine the results. “Time after Search” is the time they spend on the website after performing a search.
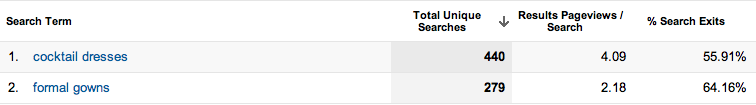
You can always use the advanced filter to see more relevant data.
![]()
For example, I might want to see search terms used over 100 times that have an exit rate over 50%.
Bounce Rate by Landing Page
The bounce rate is the percentage of your visitors that don’t engage with your website: they see a page and then they leave. This isn’t always a bad thing. Blog posts, for example, tend to have very high bounce rates; people read them and then they leave the site. But if you have a landing page where people are supposed to fill out a form, a high bounce rate means they’re not doing it.
To see your top landing pages go to Content > All Content > Landing Pages.
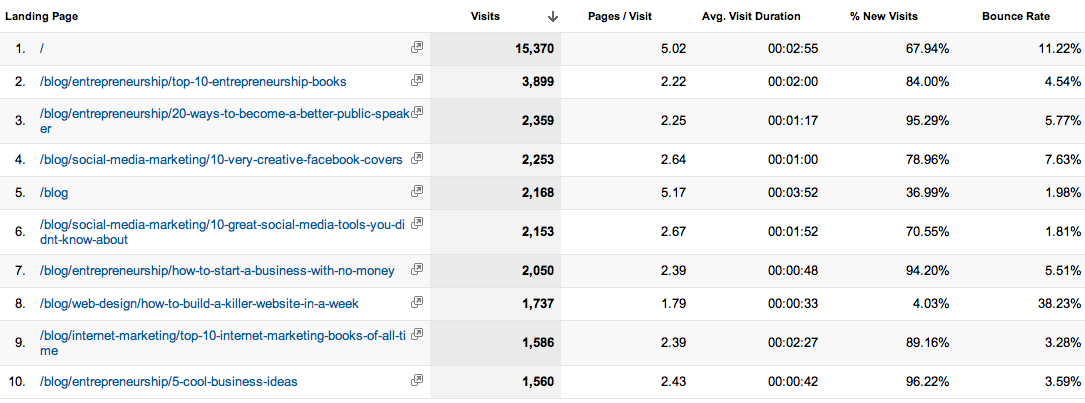
Remember, you can use advanced filters to see a specific set of data, such as pages with over 200 visits and a bounce rate over 40%.
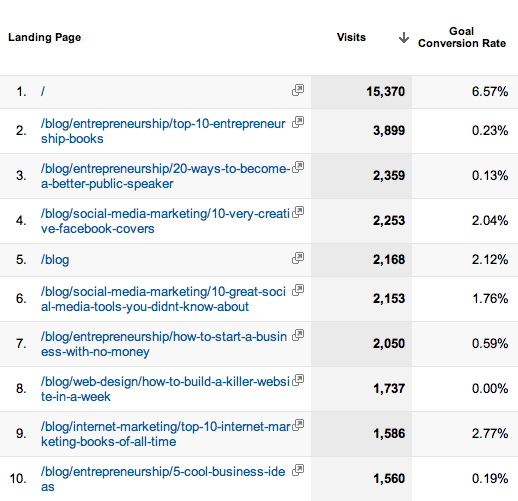
You can also see the conversion rate of each landing page. At the very top of the report, click on Goal Set 1 (if you’re tracking leads or downloads) or Ecommerce (if you have an ecommerce website.)
This is what you get:
Social Media Reports
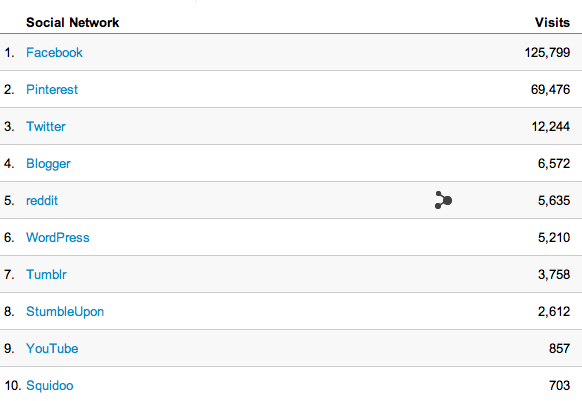
If you go to Traffic Sources > Social > Overview you can see which social media sites are driving traffic to your website.
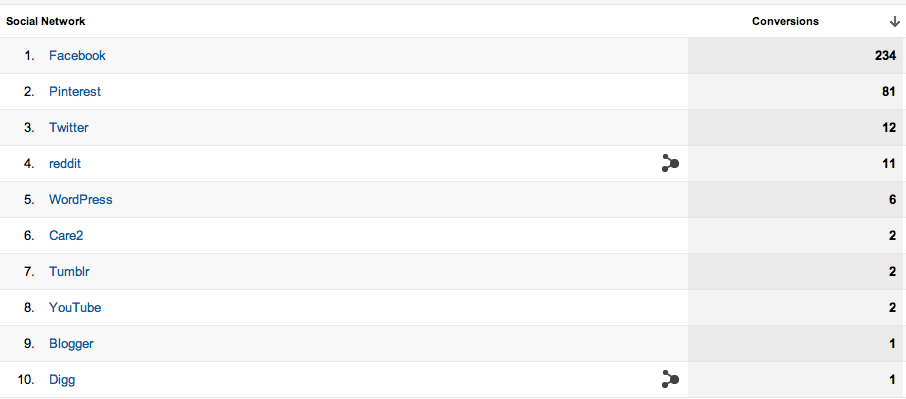
If you go to Traffic Sources > Social > Conversions you can see what traffic sources are driving conversion to your site.
If you use a social sharing plugin like ShareThis you can see what content people are sharing from your site. Go to Traffic Sources > Social > Plugins.
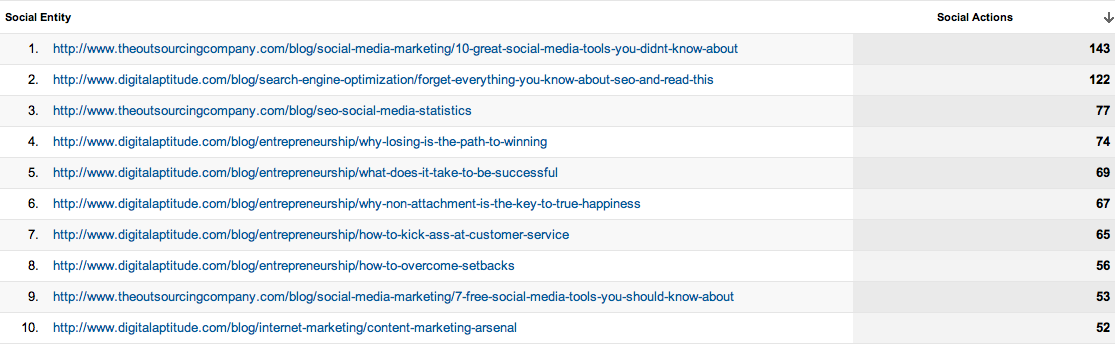
This is really important, because once you understand what content people want to share you can create more of it.
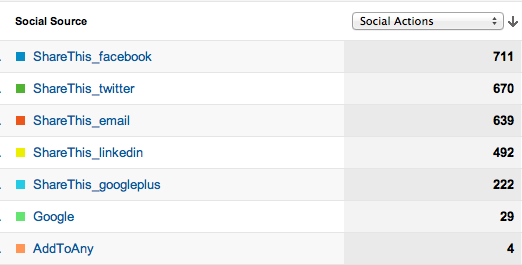
And finally, if you click on “Social Source” you can see which networks people share your content on. This is really valuable when you need to prioritize the social sharing buttons you put on your site.
Have any Google Analytics questions? Post them in the comments section below.